Turn data into insights with Business Intelligence

Bring all your data together in one clear Power BI dashboard. We take care of the integrations, help you define the right performance metrics and make your KPIs visible and easy to understand in real time for your entire team.

All data sources in one overview

By connecting all your data sources, you gain complete, real-time insights, eliminate duplicate work and always work with reliable data.

Keep your existing systems

No need for a new system. We connect to your existing software. You keep what works, and we add what's missing. You and your team can get started straight away.

We handle the entire implementation

Complete support throughout implementation. We take care of installation, delivery and team training. You benefit from tangible results quickly, without the hassle.

Datakings BI: Transform your data into dynamic insights

Datakings BI transforms your data into dynamic insights and presents them in Power BI. We offer a range of standard solutions that can connect to any data source. We also help you define the right performance metrics and develop tailored dashboards that give you continuous visibility into your KPIs.

Working with Datakings BI offers the following benefits

Real-time data in one overview

Get instant access to up-to-date information and trends, allowing you to respond quickly to changes within your organisation.

Tailor-made dashboards

Dashboards are fully tailored to your organisation and information needs, ensuring you always see what matters most.

Ready-to-use standard dashboards

Datakings BI offers standard dashboards that can be deployed quickly by simply connecting your data sources.

Automate reports and processes

Eliminate manual work and receive automatically updated reports, saving time and reducing costs.

In-depth insights for better decisions

Gain deeper insights into your data and greater control, enabling you to make better-informed decisions.

Connect all your data sources

Data from different systems is integrated into one complete and reliable overview of your organisation.

What our customers say

We were looking for a partner who understood our complexity and could turn it into a working system. Datakings worked closely with us, asked the right questions and helped us make decisions that suited our organisation.

Gerlant Compagner
Projectcontroller CROW

“I really appreciate Datakings’ personal and responsive approach. It’s a great fit for us. No complicated processes, just sitting down together, thinking things through and solving the problem. Since then, our inventory has been accurate again, and we can trust our figures.”

Erik Bennink
Directeur Efbé

“Thanks to Datakings, we’ve regained peace of mind and a clear overview of our processes. Both the tools and the personal approach have made a real difference.”

Agnes Heijboer
Finance Manager, Cmotions

Strengthen your strategy and profits further.

There's a suitable solution for every business and every situation. That includes your business. We'd be happy to tell you more!

Our specialised dashboards

Finance

Sales

Manufacturing

Management

Warehouse

HR
Finance
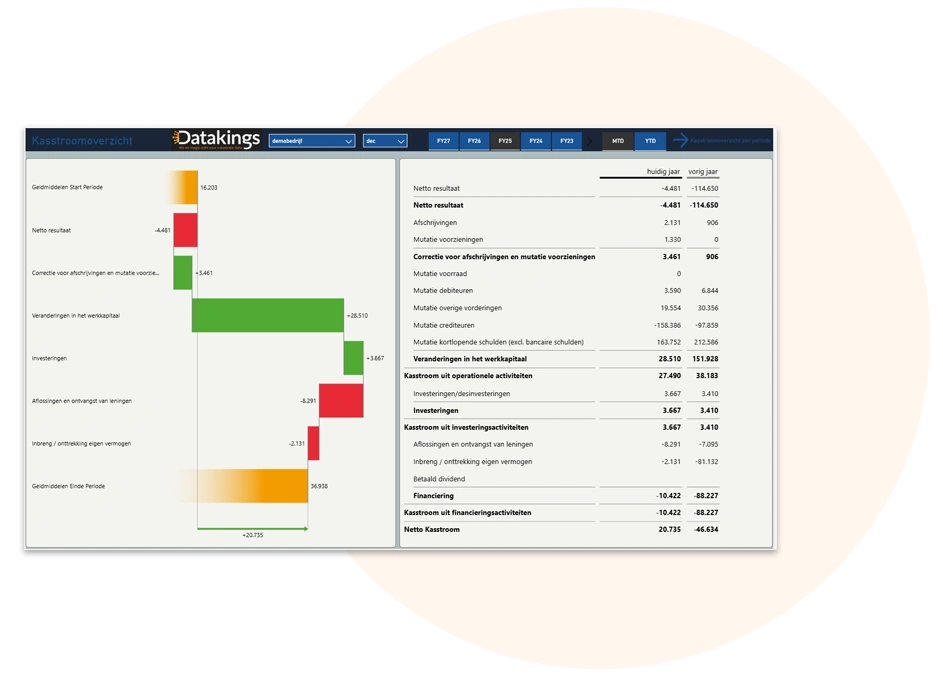
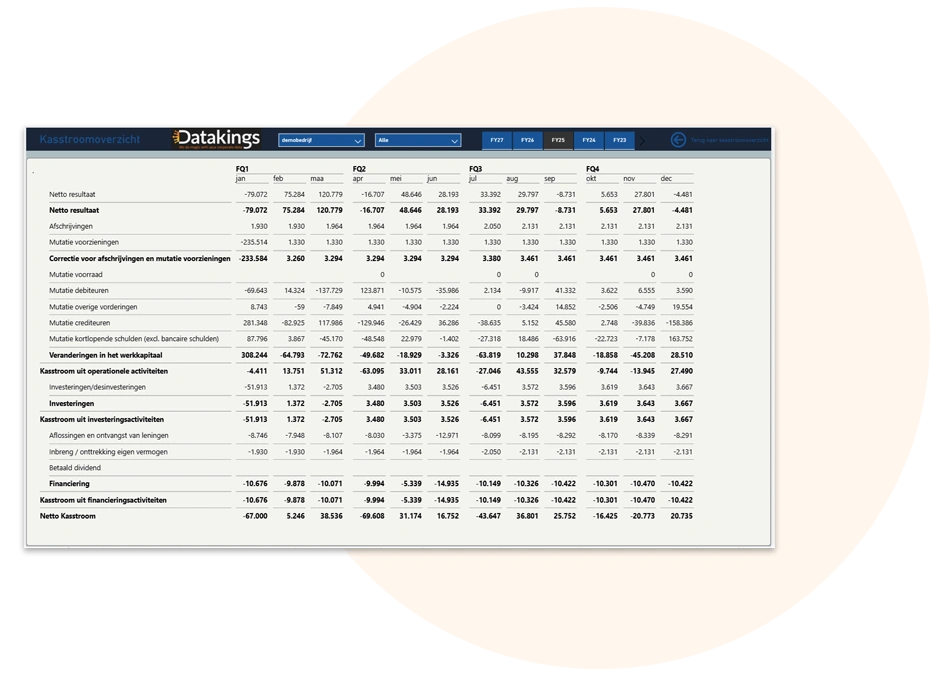
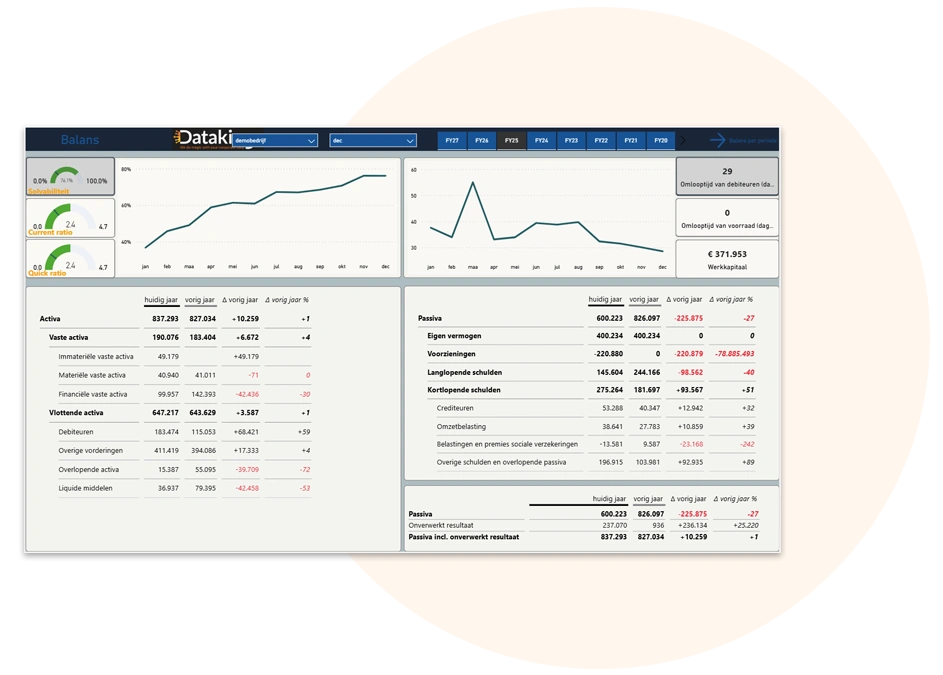
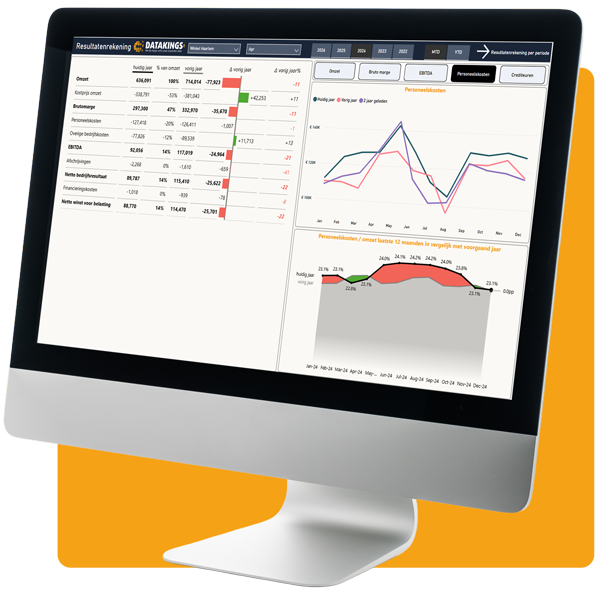
Track profit, costs and cash flow in one overview. Monitor margins, keep budgets under control and speed up your financial close with real-time reporting.
N
Profit and loss insights
N
Cash flow and budget monitoring
N
Comparison with forecasts
N
Costs by general ledger account
N
Consolidation and divisional analysis

Sales

Gain real-time insights into sales performance, margins and campaigns. Monitor product categories, regions and trends to stay on top of targets and profitability.
N
Sales by product category
N
Trends and historical figures
N
Regional and location performance
N
Campaign and ROI insights
N
Margins by segment

Manufacturing

Manage production efficiency, quality and costs. Monitor progress, improve planning and optimise production processes with real-time insights by production line or workstation.
N
Real-time production status
N
Lead time per order
N
OEE and downtime
N
Quality control and defects
N
Raw material and cost data

Management

All your strategic KPIs in one place. Combine data from multiple systems for real-time visibility and better decision-making at management and executive level.
N
Essential business KPIs
N

Strategic insights at a glance

N
Compare departments and trends
N
Share insights with teams and management

Warehouse

Gain real-time control over stock and logistics. Analyse inventory levels, picking performance and supplier performance for more efficient warehouse operations.
N
Real-time stock status
N
Picking performance by employee
N
Order fulfilment and delivery reliability
N
Stock locations and history
N
Stock turnover and ageing

HR

Manage and analyse employee data effectively. Monitor staff turnover, sickness absence, recruitment and development in one clear dashboard tailored to your HR needs.
N
Sickness absence and FTE insights
N
Employee turnover and retention
N
Recruitment and vacancies
N
Time tracking by project
N
Time tracking by project
N
KPI Dashboard
Free download

Talk to your Power BI dashboard with Claude

Ask questions about revenue, customers, orders, margins and other business data in plain language, and receive answers from your Power BI model within seconds.

Includes a working Claude configuration
25 ready-to-use prompts
Step-by-step guide
Up and running within 30 minutes
Which customers have the highest margins?
Top 5 customers by gross margin:

1. Customer A (+18%)
2. Customer B (+15%)
3. Customer C (+14%)
Power BI + Claude AI

How we help you

  1. Understanding your goals and requirements
    We start with a session to discuss your goals, users and data requirements. This helps us understand exactly which insights you need and how best to visualise them.
  2. Developing a tailored dashboard
    Based on your input, we build a clear Power BI dashboard. With smart visualisations, interactive filters and an intuitive layout, we make your data truly valuable to your team.
  3. Reporting and maintenance
    After delivery, we agree on the reporting frequency. We monitor data source connections and remain available for updates or questions. This ensures your dashboard stays reliable, up to date and scalable.

Book a meeting – Free and without obligation
Data platform for Exact Globe – Get started with Power BI in no time

At Datakings, we offer a powerful, fully hosted data platform specifically for Exact Globe users. Our platform provides access to all tables in Exact Globe, which we have also renamed using clear, recognisable terms. This makes working with data much easier, even for non-technical users. With direct access to all your business data, you can build dashboards and reports in Power BI within hours. No complicated integrations, data models or technical barriers.

What can we offer you?

N

Hosted data warehouse – No installation required, available immediately.

N

Complete Exact Globe dataset – All tables, logically renamed and ready to use.

N

Standard Power BI report – Instant insights into finance, sales, inventory and more.

N

Custom solutions available – We build tailored reports, or you can create your own if you have BI skills.

N

Training and guidance – We teach you or your team how to build reports in Power BI, step by step.

Whether you're a controller, BI consultant or business owner, our platform makes data insights accessible. Work faster, gain clarity and scale with confidence.

Frequently asked questions

Is my data suitable for a Power BI dashboard?
Absolutely! Our dashboards can easily connect to virtually any system and all types of data sources. This ensures you always gain valuable insights, regardless of how or where your data is stored.
Is the Power BI dashboard easy for my team to use?
Absolutely. We design dashboards that are user-friendly and intuitive. We also provide a practical introduction session for your team, so everyone can quickly start using the dashboard independently.
How long does it take to develop a Power BI dashboard?
Development time depends on the complexity and scope of your project. On average, we deliver a fully operational Power BI dashboard within four weeks, keeping you informed of progress and planning throughout.
What are the total costs, including licences and maintenance?
The costs consist of three elements: initial development costs, monthly licence fees per user and maintenance costs for updates and support. These are transparent, discussed clearly in advance and depend on your specific requirements.
How secure is my data in Power BI?
You always retain full ownership of your data and dashboard. We build within your existing environment, without creating data copies or using external storage. This helps you maintain control, meet compliance requirements and minimise risks.
What support is available after implementation?
We remain closely involved after delivery. You always have access to our support desk for questions, technical assistance and adjustments. This ensures your dashboard continues to perform at its best.
FREE & NO OBLIGATION
Data specialist van Datakings

Shall we have a quick chat?

We'd be happy to discuss dashboards, reporting and smarter use of data.

✓ Practical advice
✓ No obligations
✓ Immediate insight into the possibilities

Download hier je bestand

Ontvang de download direct in je mailbox

Hulp nodig bij de installatie? Vul je telefoonnummer in en we helpen je graag op weg.
Download Power BI Guide Mailcampagne